Use Data Analytics to extract insights from the different manufacturing assets
Nowadays nearly all manufacturing assets, e.g. machines, CPS and sensors, software applications and even employees, are generating zillions of data. This amount of data offers a great opportunity to those organisations that are able to understand the data they produce and the benefits they can get by “touching” some configurations they never thought it would make a difference.
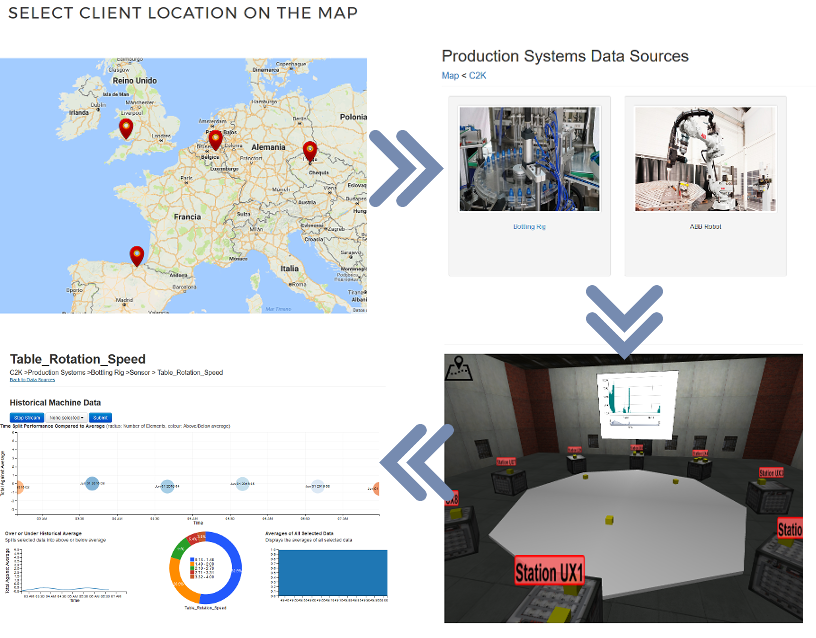
Easy data exploration
The CREMAnufacture Data Analytics module enables the easy exploration of the data fed into the system by running simple and visual queries and drilling in the graphical reporting offered. All factories are shown in a map allowing drilling from the top factory down to the asset passing over through different levels and enabling the selection of production lines and machines adapting to your complexity of your production lines. Once the asset has been selected, several dashboards project the data gathered by CREMAnufacture and conclusions could be inferred.
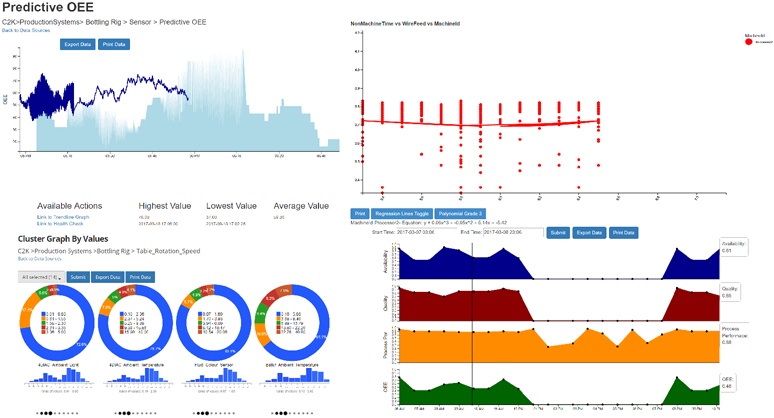
Your data at your service: Correlations, Trendlines, Dashboards
Once the Dashboard is on the screen, several graphs and visualisations can be browsed. There exist the possibilities of exploring several assets’ attributes against meaningful and self-defined KPI’s or display live data in several layouts. By means of linear regression, hidden relationships between parameters will be unleashed and insights can be extracted helping your business to optimize your production lines by adjusting the machines’ configurations. Trendlines graphics will help you in analysing how the machines are behaving under certain conditions leading to a full understanding of your factory, production lines and manufacturing assets.